About cellDancer
RNA Velocity
scRNA-seq technology enables us to capture a snapshot of each cell’s RNA transcriptome. By analyzing the spliced and unspliced mRNAs from scRNA-seq experiment data, RNA velocity can provide insights into the dynamic transition of cell state and the underlying kinetics of RNA1.
To easily understand the concept of RNA velocity, we use the cartoon of swimming pool to show the idea (Fig. 1). The transcription (α), splicing (β), and degradation (γ) rates jointly regulate the abundance of unspliced and spliced mRNA. This reaction kinetics could be represented as the two Ordinary Differential Equations (ODEs) purposed by La Manno et al. (Fig. 2)1, where u(t) and s(t) are time-dependent concentrations of the premature and mature mRNAs and α, β, γ indicate the transcription, splicing, and degradation rates, respectively.
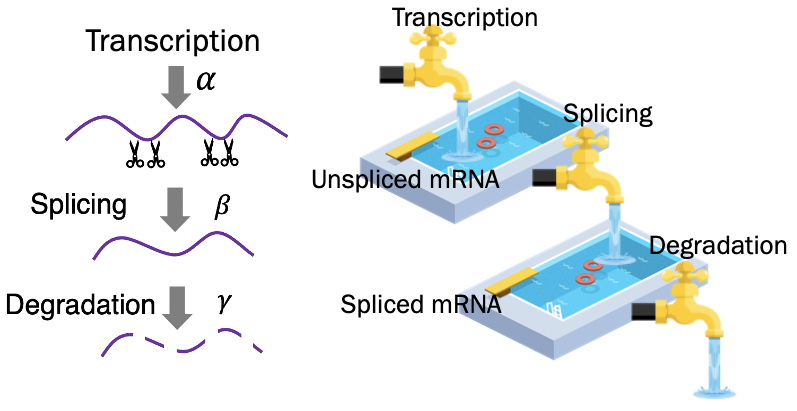
Fig. 1 The lifetime of RNA and the analogy of the swimming pool to help understanding.

Fig. 2 The two ODEs describing the reaction kinetics of mRNA.
La Manno et al. are the first to introduce the concept of RNA velocity1. In their study, the abundance of unspliced, pre-mRNA in the circadian-associated genes of mouse liver can be the percussor of spliced, mature mRNA abundance (Fig. 3; s represents spliced, mature mRNA; u represents unspliced, pre-mRNA). The corresponding kinetics could be described by ODEs in Fig. 2.
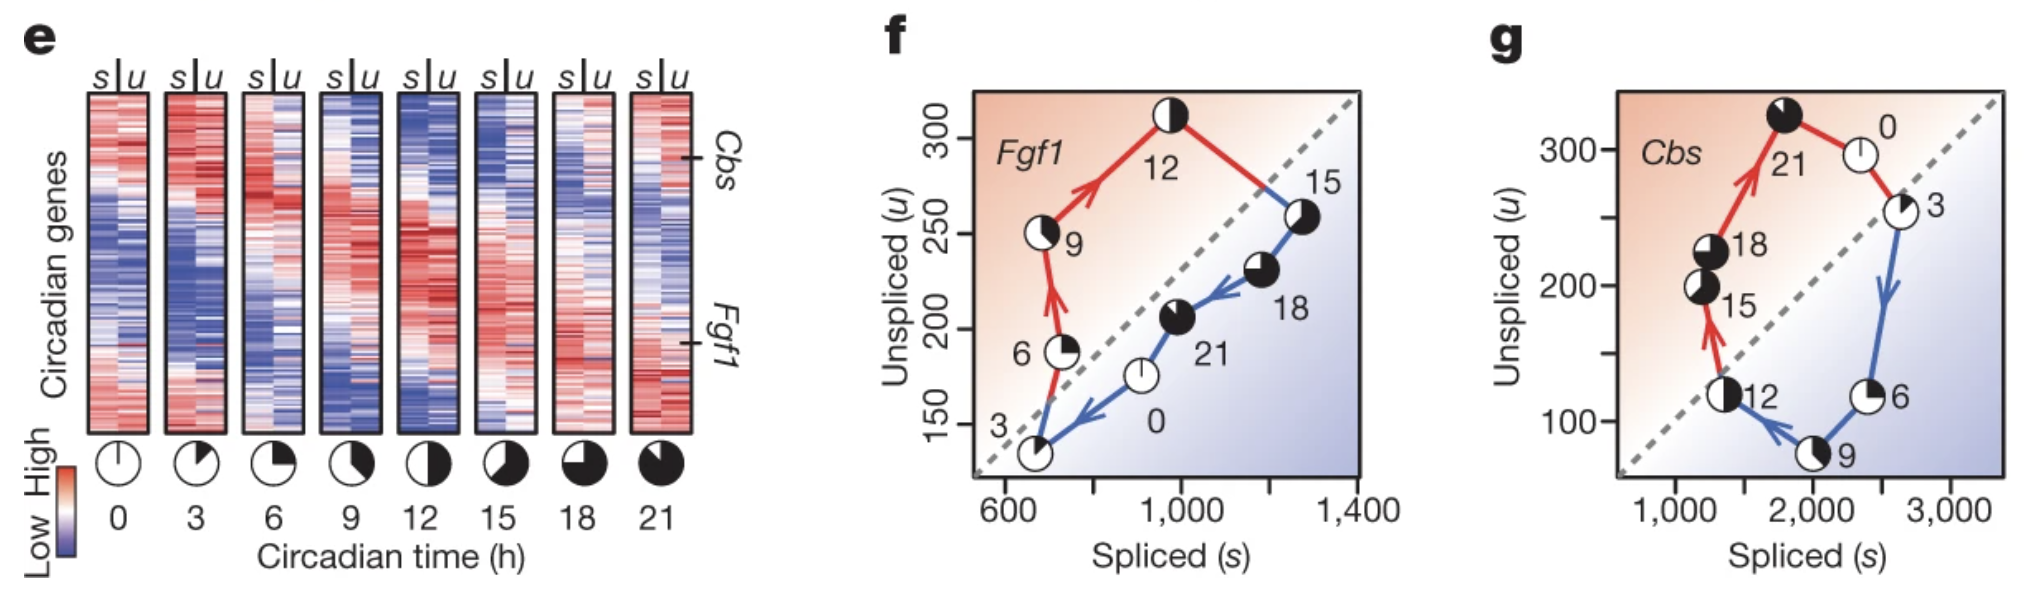
Fig. 3 e, Abundance of spliced (s) and unspliced (u) mRNAs for circadian-associated genes in the mouse liver. f, g, Phase portraits observed for a pair of circadian-driven genes: Fgf1 (f) and Cbs (g). (adapted from La Manno et al., Nature, 2018)
ds/dt and du/dt could be obtained by estimating the transcription (α), splicing (β), and degradation (γ) rates. Existing methods have certain limitations in the hypothesis of kinetic rates, α is either a constant (velocyto model1) or binary values (scVelo model2), and β and γ are shared by all the genes and cells, which may have unpredictable performance, while cellDancer can predict the specific α, β and γ of each gene in each cell through deep learning (Fig. 4).
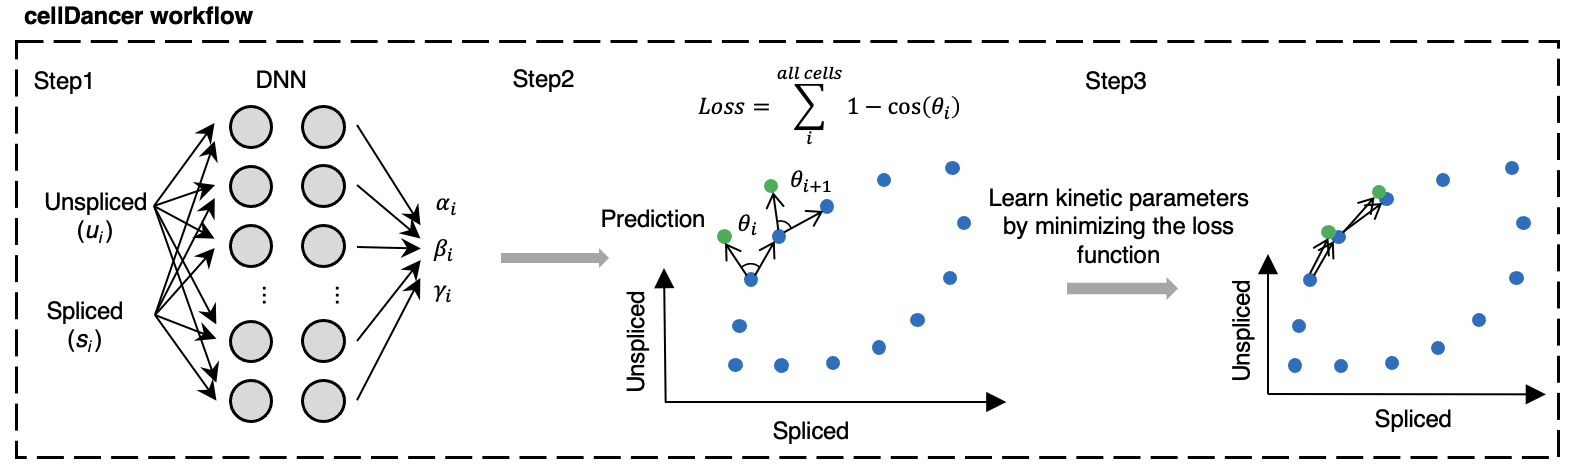
Fig. 4 The deep learning work flow of cellDancer.
In our algorithm, cellDancer3 minimizes a loss function, which measures the similarity between predicted and observed velocity vectors. The gene phase portraits of Sulf2 in the pancreatic endocrinogenesis data and Gnao1 in the mouse hippocampus development data below show the training process of the DNN (deep neural network) (Fig. 5).
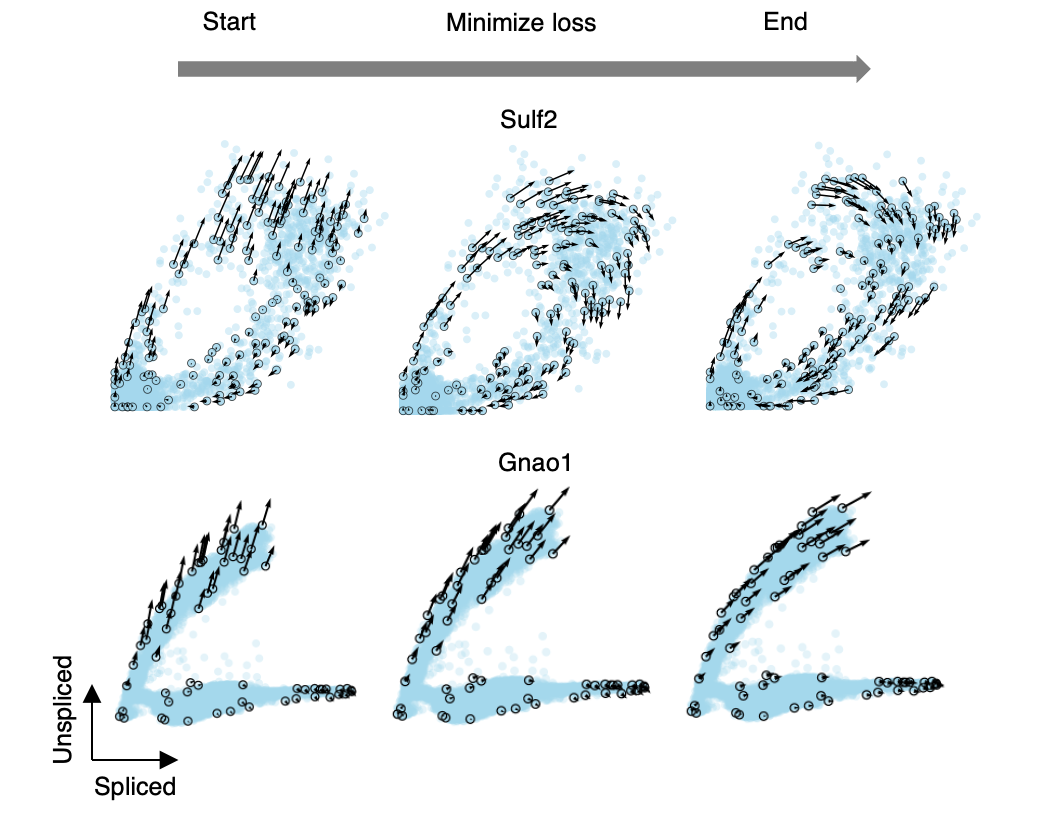
Fig. 5 The progress of minimizing the loss function.
For more information, Supplementary Note 1 contains the prototype of our model.
Applications of cellDancer
cellDancer can accurately predict the cell state transitions in heterogeneous cell populations of multiple benchmark datasets, including mouse gastrulation erythroid maturation (Figure 6, upper left), mouse hippocampus development (Fig. 6, upper right), human embryonic glutamatergic neurogenesis (Fig. 6, bottom left), and mouse endocrine development (Fig. 6, bottom right).
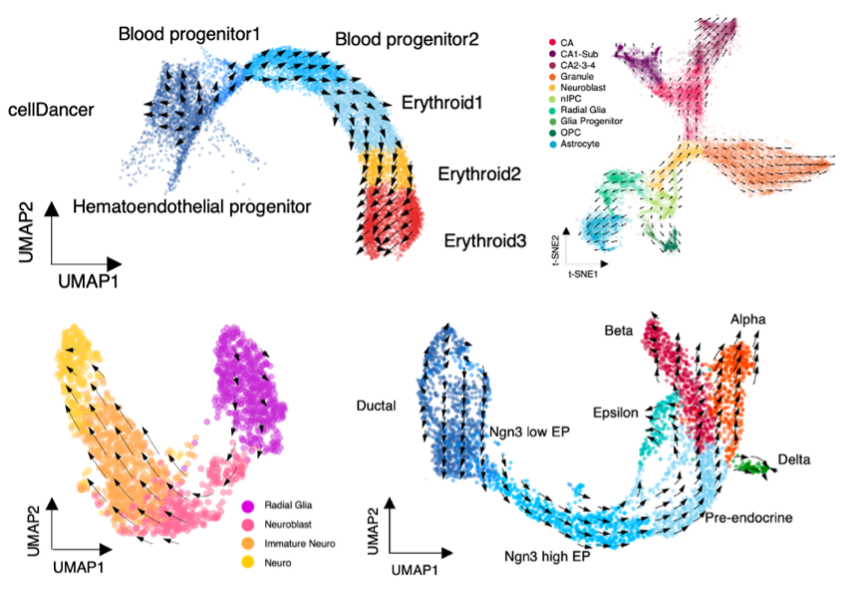
Fig. 6 The cell states transitions predicted by cellDancer.
cellDancer could infer the transcription (α), splicing (β), and degradation (γ) rates of RNA for each gene in each cell. Metabolic labeling4 is an experimental method that measures transcription rate and degradation rate. Using the metabolic labeling data (i.e., scEU-seq) of RPE1-FUCCI cells during cell cycle progression, we verify the cellDancer-predicted kinetic parameters are consistent with the reality mRNA turnover rates in cell cycle (Fig. 7).
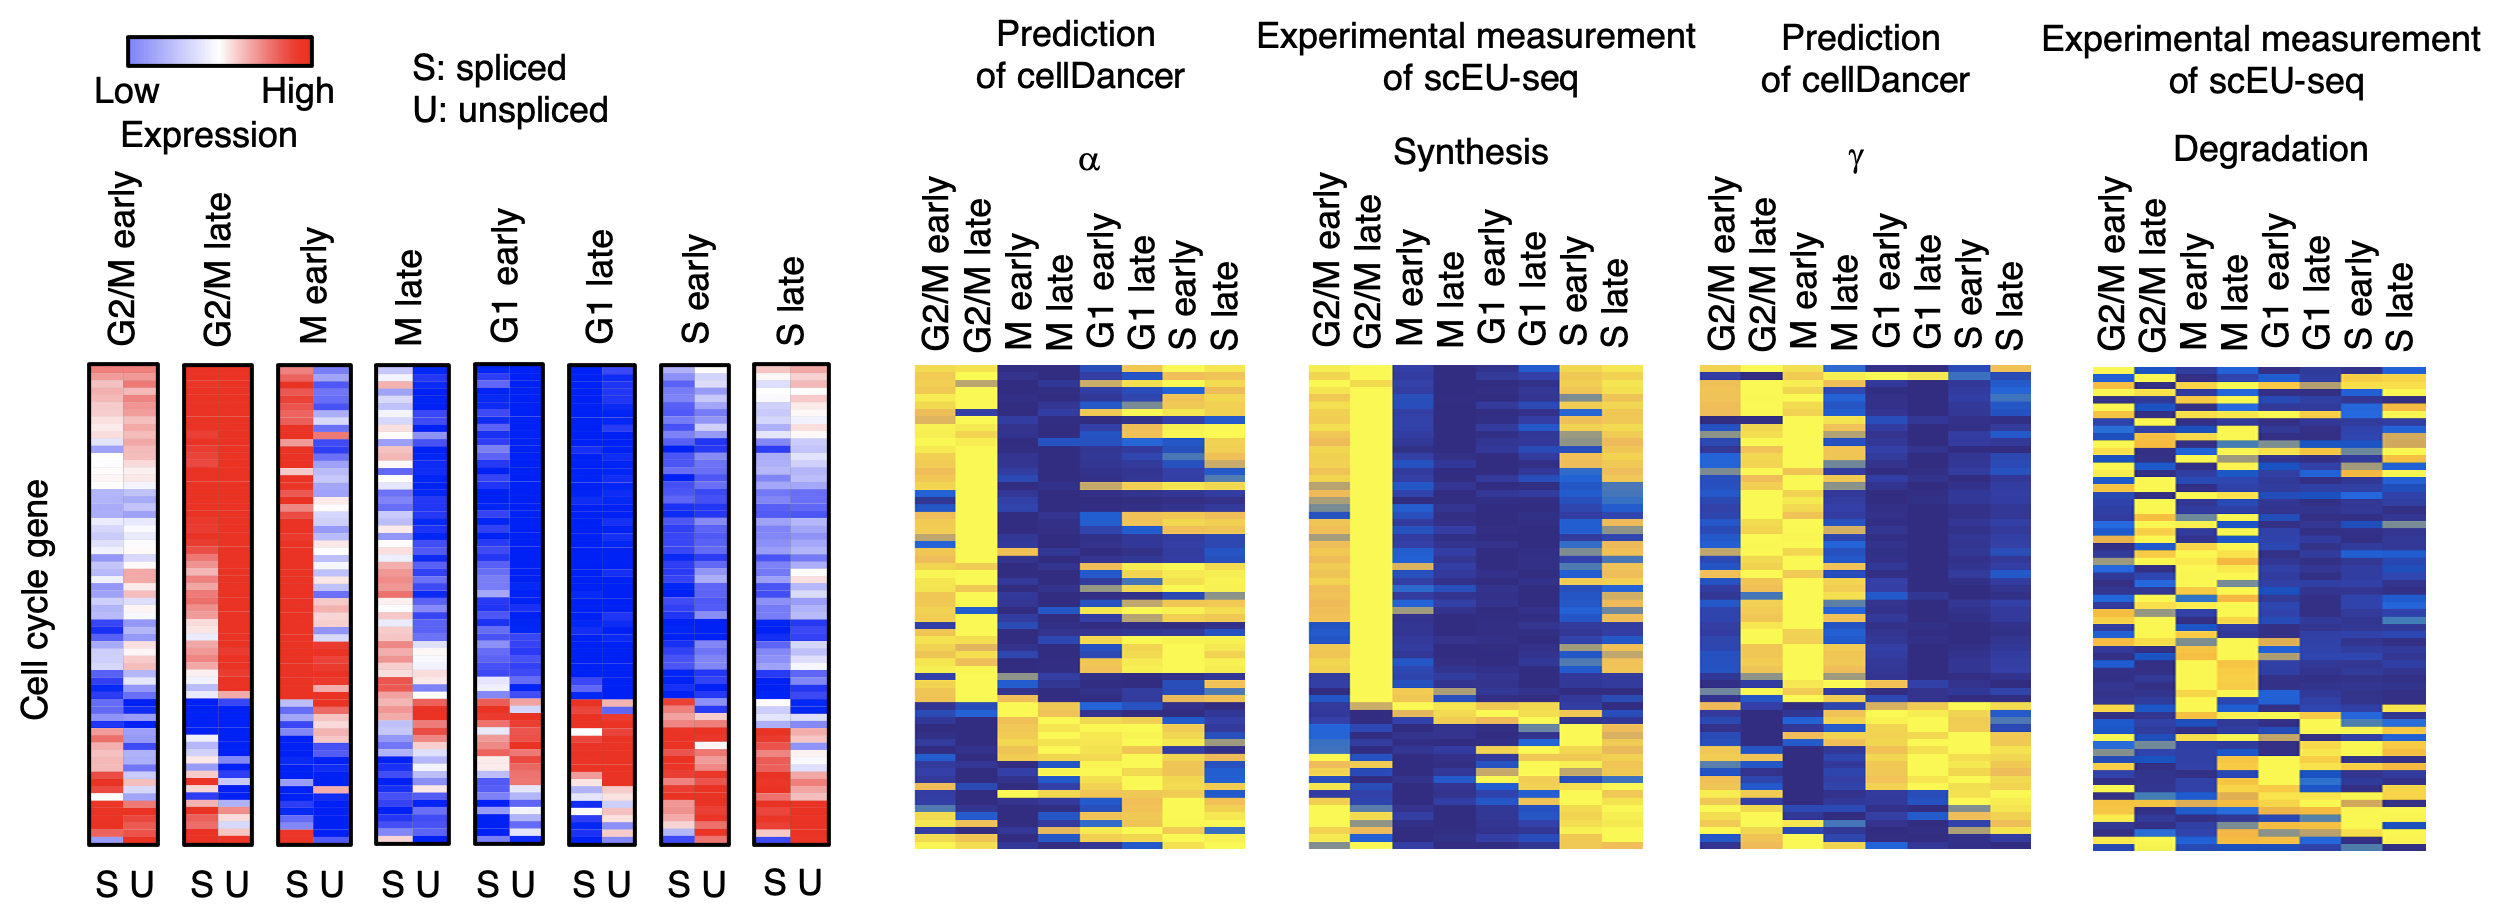
Fig. 7 a, The spliced and unspliced reads of cell cycle genes in the cell cycle progression. b, Heatmaps show 𝛼, β, and γ estimated by cellDancer (first column) is associated with the experimentally derived synthesis and degradation status in scEU-seq (second column) in the cell cycle progress.
We cluster the genes by the predicted transcription and degradation rates to study the turnover strategy of RNA (Fig. 8). The genes in cluster F are enriched in pathways related to cell communication, including signal transduction, enzyme-linked receptor protein signaling, TGFβ receptor signaling, and stress-activated protein kinase signaling, suggesting a quick communication of cells during mitosis. Cell cycle-related pathways are also enriched in other clusters.

Fig. 8 Genes are clustered into seven groups according to their dynamic patterns of 𝛼 and γ.
Based on the RNA velocity predicted by cellDancer, we in silico suppress the expression of Gata2 in the early stage of blood progenitor cell (Fig. 9). The perturbation results verify the critical role of Gata2 in hematopoiesis.
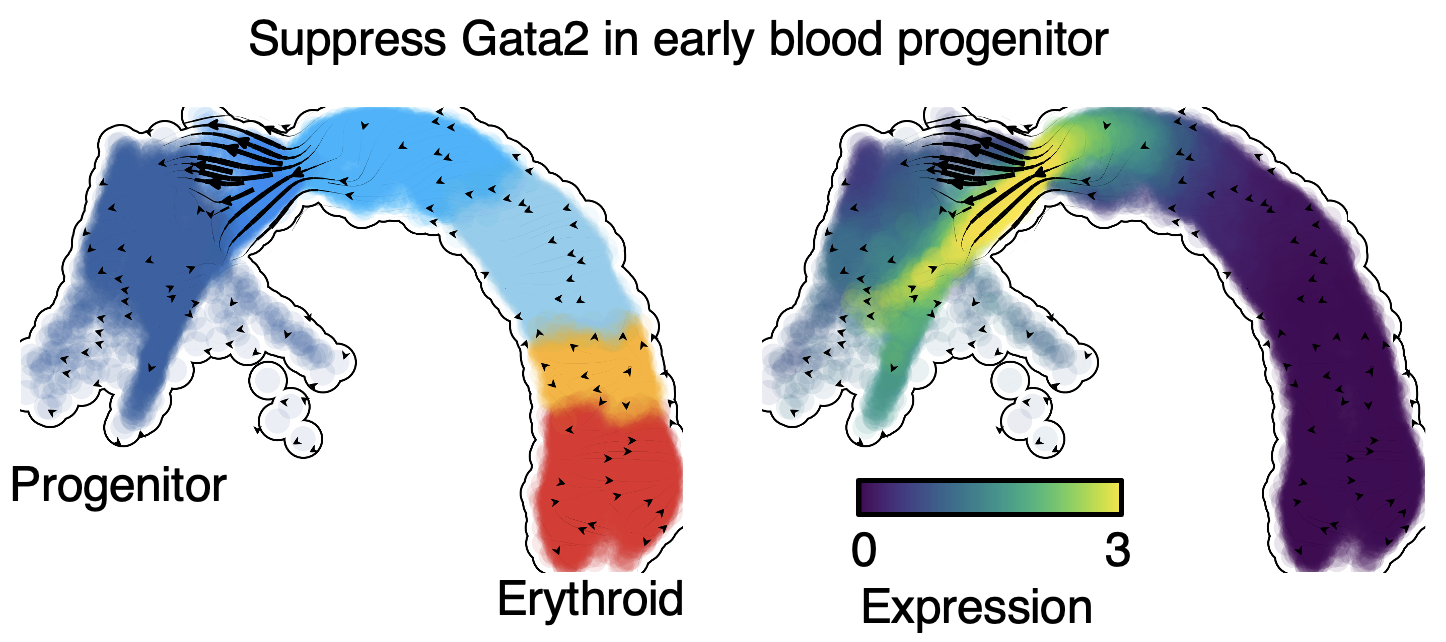
Fig. 9 In silico perturbation analysis by dynamo shows a critical role of Gata2 in hematopoiesis.
References
La Manno, G. et al. RNA velocity of single cells. Nature 560, 494-+ (2018).
Bergen, V., Lange, M., Peidli, S., Wolf, F.A. & Theis, F.J. Generalizing RNA velocity to transient cell states through dynamical modeling. Nat Biotechnol 38 (2020).
Li, S. et al. A relay velocity model infers cell-dependent RNA velocity. Nat Biotechnol (2023).
Battich, N. et al. Sequencing metabolically labeled transcripts in single cells reveals mRNA turnover strategies. Science 367, 1151-1156 (2020).