Case study 4: Human embryo glutamatergic neurogenesis
This tutorial shows the analyses of the human embryo glutamatergic neurogenesis dataset. There are 1,054 genes and 1,720 cells in the preprocessed dataset.
Import packages
[1]:
import os
import sys
import glob
import pandas as pd
import anndata as ann
import math
import matplotlib.pyplot as plt
import celldancer as cd
import celldancer.utilities as cdutil
import celldancer.cdplt as cdplt
from celldancer.cdplt import colormap
Load cellDancer result
Below are the command we used for the RNA velocity estimation.
cd.velocity(cell_type_u_s, permutation_ratio=0.3, max_epoches=150, norm_u_s = False, speed_up=False)
The result can be downloaded from HgForebrainGlut_cellDancer_estimation_spliced.csv.zip.
[2]:
# load the prediction result of all genes
cellDancer_df_file = 'your_path/HgForebrainGlut_cellDancer_estimation_spliced.csv'

cellDancer_df=pd.read_csv(cellDancer_df_file)
cellDancer_df
[2]:
| cellIndex | gene_name | unsplice | splice | unsplice_predict | splice_predict | alpha | beta | gamma | loss | cellID | clusters | embedding1 | embedding2 | |
|---|---|---|---|---|---|---|---|---|---|---|---|---|---|---|
| 0 | 0 | SCAPER | 0.377907 | 0.300250 | 0.413027 | 0.319656 | 0.290919 | 0.583949 | 0.605718 | 0.063386 | 10X_17_028:AACCATGGTAATCACCx | Neuroblast | -0.162233 | 2.568855 |
| 1 | 1 | SCAPER | 0.346111 | 0.307946 | 0.385507 | 0.315725 | 0.281298 | 0.585087 | 0.607075 | 0.063386 | 10X_17_028:AACCATGCATACTACGx | Neuroblast | 0.388010 | 2.642608 |
| 2 | 2 | SCAPER | 0.377427 | 0.157733 | 0.431398 | 0.219263 | 0.324510 | 0.573801 | 0.592829 | 0.063386 | 10X_17_028:AAACCTGGTAAAGGAGx | Radial Glia | 5.367040 | 7.357098 |
| 3 | 3 | SCAPER | 0.450290 | 0.237188 | 0.482404 | 0.296366 | 0.324551 | 0.578121 | 0.598542 | 0.063386 | 10X_17_028:AAAGTAGCAAAGTCAAx | Radial Glia | 3.537705 | 9.916307 |
| 4 | 4 | SCAPER | 0.405460 | 0.349812 | 0.429939 | 0.362193 | 0.286943 | 0.586949 | 0.609536 | 0.063386 | 10X_17_028:AAAGCAACAAACGCGAx | Neuroblast | -1.321112 | 2.327503 |
| ... | ... | ... | ... | ... | ... | ... | ... | ... | ... | ... | ... | ... | ... | ... |
| 1812875 | 1715 | PCP4 | 0.000000 | 0.017668 | 0.000006 | 0.017446 | 0.000013 | 0.212723 | 0.025128 | 0.061695 | 10X_17_029:TTTATGCGTTGCGCACx | Radial Glia | 3.227375 | 8.551692 |
| 1812876 | 1716 | PCP4 | 0.000000 | 0.012055 | 0.000007 | 0.011903 | 0.000013 | 0.213251 | 0.025116 | 0.061695 | 10X_17_029:TTTGCGCGTTCCGTCTx | Neuroblast | -2.402294 | 2.295248 |
| 1812877 | 1717 | PCP4 | 0.004955 | 0.156260 | 0.004462 | 0.154773 | 0.000007 | 0.200527 | 0.025388 | 0.061695 | 10X_17_029:TTTGGTTGTACCCAATx | Neuron | -7.754744 | 7.540400 |
| 1812878 | 1718 | PCP4 | 0.000000 | 0.014440 | 0.000007 | 0.014259 | 0.000013 | 0.213026 | 0.025121 | 0.061695 | 10X_17_029:TTTCCTCCAGTCCTTCx | Radial Glia | 4.793538 | 10.079043 |
| 1812879 | 1719 | PCP4 | 0.000000 | 0.031939 | 0.000006 | 0.031537 | 0.000012 | 0.211386 | 0.025157 | 0.061695 | 10X_17_029:TTTGCGCCACAGATTCx | Radial Glia | 4.782735 | 5.872306 |
1812880 rows × 14 columns
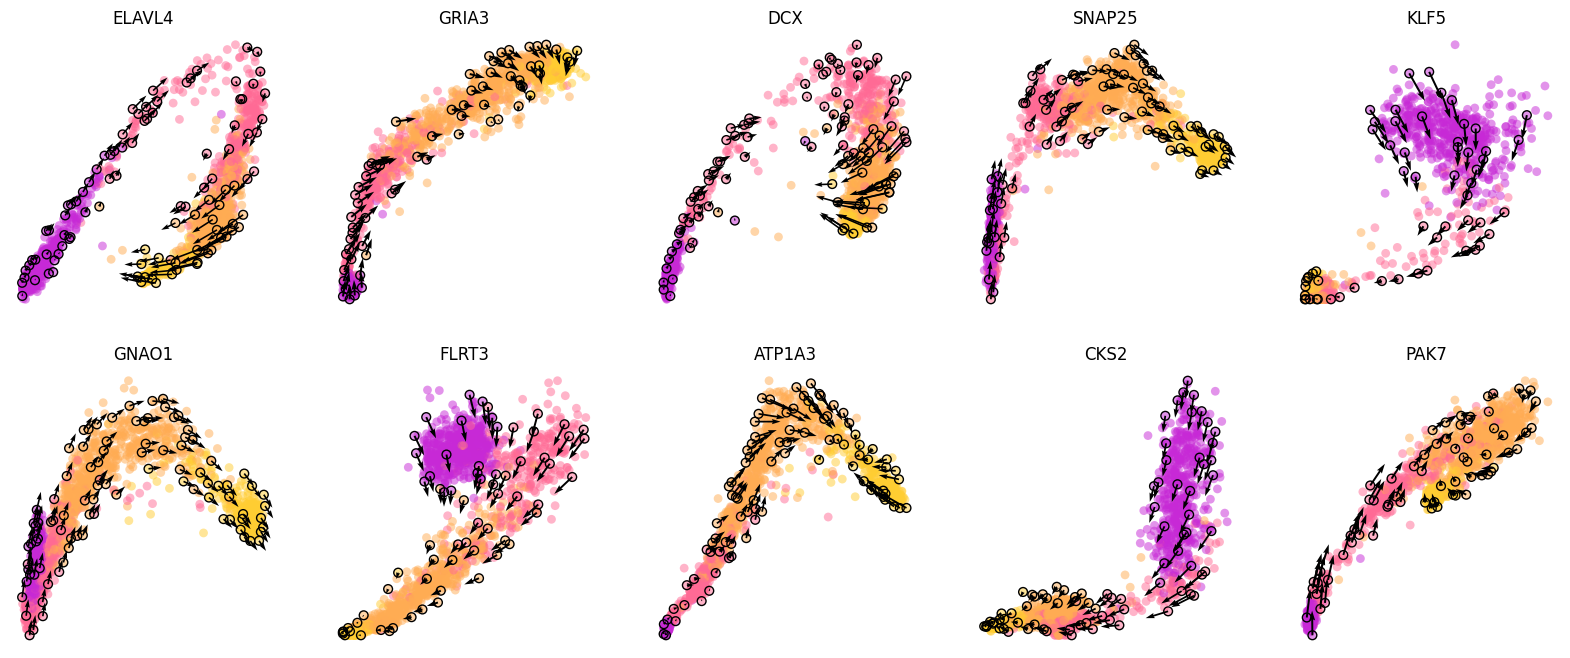
Visualize the phase portraits
[3]:
gene_list=['ELAVL4', 'GRIA3', 'DCX', 'SNAP25', 'KLF5', 'GNAO1', 'FLRT3', 'ATP1A3', 'CKS2', 'PAK7']

ncols=5
height=math.ceil(len(gene_list)/ncols)*4
fig = plt.figure(figsize=(20,height))

for i in range(len(gene_list)):
    ax = fig.add_subplot(math.ceil(len(gene_list)/ncols), ncols, i+1)
    cdplt.scatter_gene(
        ax=ax,
        x='splice',
        y='unsplice',
        cellDancer_df=cellDancer_df,
        custom_xlim=None,
        custom_ylim=None,
        colors=colormap.colormap_hgforebrainglut,
        alpha=0.5,
        s = 40,
        velocity=True,
        gene=gene_list[i])

    ax.set_title(gene_list[i])
    ax.axis('off')
plt.show()
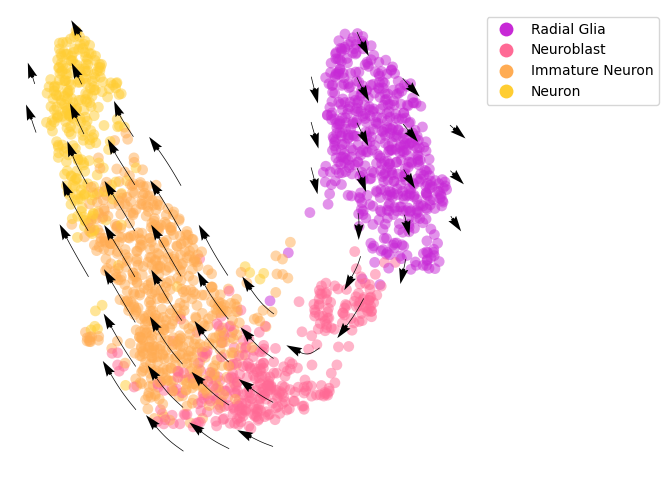
Project the RNA velocity onto the embedding space
We calculate the projection of RNA velocity on the embedding with cd.compute_cell_velocity().
[4]:
# compute cell velocity
cellDancer_df=cd.compute_cell_velocity(cellDancer_df=cellDancer_df,
                                       projection_neighbor_choice='embedding',
                                       expression_scale='power10',
                                       projection_neighbor_size=100)
[5]:
# plot cell velocity
fig, ax = plt.subplots(figsize=(6,6))

cdplt.scatter_cell(ax,
                   cellDancer_df,
                   colors=colormap.colormap_hgforebrainglut,
                   alpha=0.5,
                   s=60,
                   velocity=True,
                   legend='on',
                   min_mass=7,
                   arrow_grid=(10,10),
                   legend_marker_size=10)
ax.axis('off')
plt.show()
cellDancer is insensitive to the methods of neighbor cells detection
Here we estimate RNA velocities based on neighbor cells defined by both the spliced and unspliced abundances. A new UMAP embedding based on both the unspliced and spliced RNA abundances is used.
Below are the command we used for the RNA velocity estimation.
cellDancer_df_u_s = cd.velocity(cell_type_u_s, permutation_ratio=0.3, max_epoches=150, norm_u_s = False, norm_cell_distribution = False, speed_up=False, patience=3)
The result can be downloaded from HgForebrainGlut_cellDancer_estimation_unspliced_spliced.csv.zip.
[6]:
# load the prediction result of all genes
cellDancer_df_u_s_file = 'your_path/HgForebrainGlut_cellDancer_estimation_unspliced_spliced.csv'
cellDancer_df_u_s=pd.read_csv(cellDancer_df_u_s_file)
cellDancer_df_u_s
[6]:
| cellIndex | gene_name | unsplice | splice | unsplice_predict | splice_predict | alpha | beta | gamma | loss | cellID | clusters | embedding1 | embedding2 | |
|---|---|---|---|---|---|---|---|---|---|---|---|---|---|---|
| 0 | 0 | SCAPER | 0.377907 | 0.300250 | 0.405763 | 0.312984 | 0.272667 | 0.574098 | 0.637763 | 0.067002 | 10X_17_028:AACCATGGTAATCACCx | Neuroblast | -0.089552 | 1.610141 |
| 1 | 1 | SCAPER | 0.346111 | 0.307946 | 0.376842 | 0.309154 | 0.260747 | 0.575780 | 0.639291 | 0.067002 | 10X_17_028:AACCATGCATACTACGx | Neuroblast | 0.177206 | 1.852133 |
| 2 | 2 | SCAPER | 0.377427 | 0.157733 | 0.425090 | 0.214923 | 0.307992 | 0.563463 | 0.623120 | 0.067002 | 10X_17_028:AAACCTGGTAAAGGAGx | Radial Glia | 7.815600 | 5.937497 |
| 3 | 3 | SCAPER | 0.450290 | 0.237188 | 0.478714 | 0.290154 | 0.312150 | 0.566972 | 0.629754 | 0.067002 | 10X_17_028:AAAGTAGCAAAGTCAAx | Radial Glia | 6.701630 | 8.941791 |
| 4 | 4 | SCAPER | 0.405460 | 0.349812 | 0.423425 | 0.354449 | 0.269818 | 0.576849 | 0.642101 | 0.067002 | 10X_17_028:AAAGCAACAAACGCGAx | Neuroblast | -1.126250 | 1.166313 |
| ... | ... | ... | ... | ... | ... | ... | ... | ... | ... | ... | ... | ... | ... | ... |
| 1812875 | 1715 | PCP4 | 0.000000 | 0.017668 | 0.000006 | 0.017446 | 0.000013 | 0.214343 | 0.025120 | 0.055841 | 10X_17_029:TTTATGCGTTGCGCACx | Radial Glia | 5.943436 | 7.754985 |
| 1812876 | 1716 | PCP4 | 0.000000 | 0.012055 | 0.000007 | 0.011903 | 0.000013 | 0.214868 | 0.025108 | 0.055841 | 10X_17_029:TTTGCGCGTTCCGTCTx | Neuroblast | -2.248025 | 0.979071 |
| 1812877 | 1717 | PCP4 | 0.004955 | 0.156260 | 0.004458 | 0.154778 | 0.000007 | 0.202196 | 0.025381 | 0.055841 | 10X_17_029:TTTGGTTGTACCCAATx | Neuron | -8.651434 | 4.843134 |
| 1812878 | 1718 | PCP4 | 0.000000 | 0.014440 | 0.000006 | 0.014259 | 0.000013 | 0.214645 | 0.025113 | 0.055841 | 10X_17_029:TTTCCTCCAGTCCTTCx | Radial Glia | 7.854761 | 8.556604 |
| 1812879 | 1719 | PCP4 | 0.000000 | 0.031939 | 0.000006 | 0.031537 | 0.000012 | 0.213011 | 0.025150 | 0.055841 | 10X_17_029:TTTGCGCCACAGATTCx | Radial Glia | 6.311304 | 4.712346 |
1812880 rows × 14 columns
[7]:
# compute cell velocity
cellDancer_df_u_s=cd.compute_cell_velocity(cellDancer_df=cellDancer_df_u_s,
                                       projection_neighbor_choice='embedding',
                                       expression_scale='power10',
                                       projection_neighbor_size=100)

# plot cell velocity
fig, ax = plt.subplots(figsize=(6,6))

cdplt.scatter_cell(ax,
                   cellDancer_df_u_s,
                   colors=colormap.colormap_hgforebrainglut,
                   alpha=0.5,
                   s=60,
                   velocity=True,
                   legend='on',
                   min_mass=5,
                   arrow_grid=(10,10),
                   legend_marker_size=10)
ax.axis('off')
plt.show()
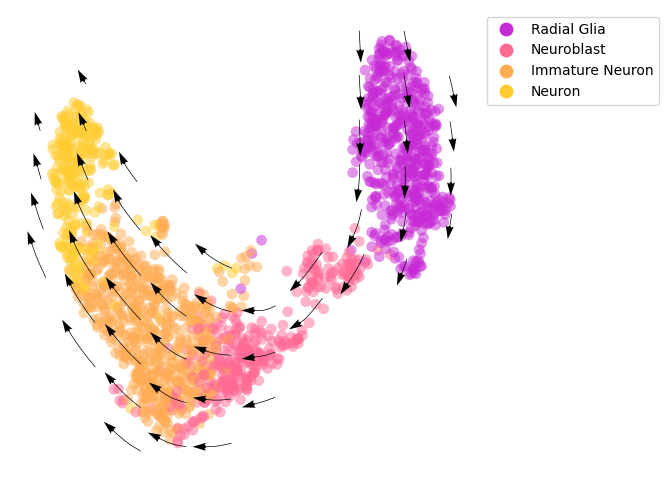
This is consistent with the aforementioned prediction based on neighbor cells defined by the spliced RNA abundances.
Estimate pseudotime
Based on the projection of RNA velocity on embedding space, we estimate the pseudotime with cd.pseudo_time().
[8]:
%%capture
# set parameters
dt = 0.05
t_total = {dt:int(10/dt)}
n_repeats = 10

# estimate pseudotime
cellDancer_df = cd.pseudo_time(cellDancer_df=cellDancer_df,
                               grid=(30,30),
                               dt=dt,
                               t_total=t_total[dt],
                               n_repeats=n_repeats,
                               speed_up=(100,100),
                               n_paths = 3,
                               psrng_seeds_diffusion=[i for i in range(n_repeats)],
                               n_jobs=8)
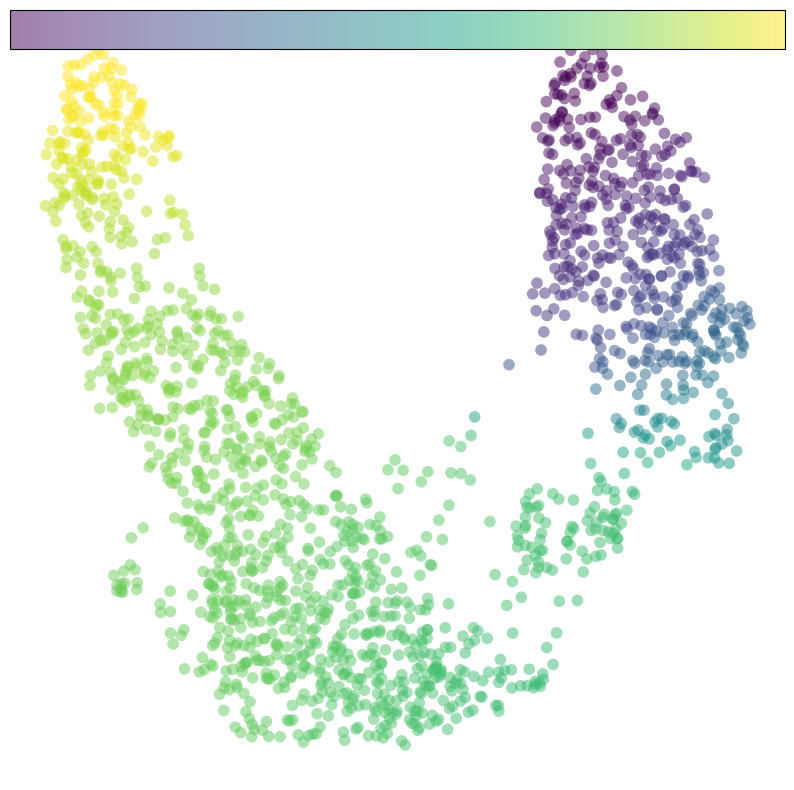
[9]:
# plot pseudotime
fig, ax = plt.subplots(figsize=(10,10))
im=cdplt.scatter_cell(ax,cellDancer_df,
                      colors='pseudotime',
                      alpha=0.5,
                      s=70,
                      velocity=False,
                      # colorbar='on'
                     )
ax.axis('off')
plt.show()