Downstream analysis using Dynamo
cellDancer could be integrated into downstream analysis, such as dynamo proposed by Qiu et al.
In this tutorial, the output of cellDancer (PancreaticEndocrinogenesis_cellDancer_estimation.csv) in pancreatic endocrinogenesis is transferred to adata as dynamo input. We apply dynamo to (1) perform vector field analysis and (2) detect gene regulation with Jacobian analysis.
Import packages
To run the notebook locally, both cellDancer and dynamo are need. Refer cellDancer and dynamo for instructions of building the packages.
[1]:
import random
import numpy as np
import pandas as pd
import numpy as np
import scipy
import warnings
warnings.filterwarnings('ignore')
import dynamo as dyn
from celldancer.utilities import export_velocity_to_dynamo
|-----> setting visualization default mode in dynamo. Your customized matplotlib settings might be overritten.
[2]:
dyn.configuration.set_figure_params('dynamo', background='white')
Input the prediction of cellDancer to dynamo
We import the cellDancer predicted RNA velocity to dynamo adata with API export_velocity_to_dynamo().
[3]:
# First create dynamo adata
adata_dyn = dyn.sample_data.pancreatic_endocrinogenesis()
pancreas_genes = ["Hes1","Nkx6-1","Nkx2-2","Neurog3","Neurod1","Pax4","Pax6","Arx","Pdx1","Ins1","Ins2","Ghrl","Ptf1a","Iapp","Isl1", "Sox9","Gcg"]
dyn.pp.recipe_monocle(adata_dyn, n_top_genes=4000, fg_kwargs={"shared_count": 20}, genes_to_append=pancreas_genes)
dyn.tl.dynamics(adata_dyn, model='static')

# replace adata.layers['velocity_S'], adata.var['use_for_dynamics'], and adata.var['use_for_transition'] with cellDancer outputs.
cellDancer_df = pd.read_csv('your_path/PancreaticEndocrinogenesis_cellDancer_estimation.csv')
adata = export_velocity_to_dynamo(cellDancer_df,adata_dyn)
|-----> Downloading data to ./data/endocrinogenesis_day15.h5ad
|-----> recipe_monocle_keep_filtered_cells_key is None. Using default value from DynamoAdataConfig: recipe_monocle_keep_filtered_cells_key=True
|-----> recipe_monocle_keep_filtered_genes_key is None. Using default value from DynamoAdataConfig: recipe_monocle_keep_filtered_genes_key=True
|-----> recipe_monocle_keep_raw_layers_key is None. Using default value from DynamoAdataConfig: recipe_monocle_keep_raw_layers_key=True
|-----> apply Monocole recipe to adata...
|-----> <insert> pp to uns in AnnData Object.
|-----------> <insert> has_splicing to uns['pp'] in AnnData Object.
|-----------> <insert> has_labling to uns['pp'] in AnnData Object.
|-----------> <insert> splicing_labeling to uns['pp'] in AnnData Object.
|-----------> <insert> has_protein to uns['pp'] in AnnData Object.
|-----> ensure all cell and variable names unique.
|-----> ensure all data in different layers in csr sparse matrix format.
|-----> ensure all labeling data properly collapased
|-----------> <insert> tkey to uns['pp'] in AnnData Object.
|-----------> <insert> experiment_type to uns['pp'] in AnnData Object.
|-----> filtering cells...
|-----> <insert> pass_basic_filter to obs in AnnData Object.
|-----> 3696 cells passed basic filters.
|-----> filtering gene...
|-----> <insert> pass_basic_filter to var in AnnData Object.
|-----> 6956 genes passed basic filters.
|-----> calculating size factor...
|-----> selecting genes in layer: X, sort method: SVR...
|-----> <insert> frac to var in AnnData Object.
|-----> size factor normalizing the data, followed by log1p transformation.
|-----> Set <adata.X> to normalized data
|-----> applying PCA ...
|-----> <insert> pca_fit to uns in AnnData Object.
|-----> <insert> ntr to obs in AnnData Object.
|-----> <insert> ntr to var in AnnData Object.
|-----> cell cycle scoring...
|-----> computing cell phase...
|-----> [cell phase estimation] in progress: 100.0000%
|-----> [cell phase estimation] finished [23.2167s]
|-----> <insert> cell_cycle_phase to obs in AnnData Object.
|-----> <insert> cell_cycle_scores to obsm in AnnData Object.
|-----> [Cell Cycle Scores Estimation] in progress: 100.0000%
|-----> [Cell Cycle Scores Estimation] finished [0.5055s]
|-----> [recipe_monocle preprocess] in progress: 100.0000%
|-----> [recipe_monocle preprocess] finished [7.7637s]
|-----> dynamics_del_2nd_moments_key is None. Using default value from DynamoAdataConfig: dynamics_del_2nd_moments_key=False
|-----------> removing existing M layers:[]...
|-----------> making adata smooth...
|-----> calculating first/second moments...
|-----> [moments calculation] in progress: 100.0000%
|-----> [moments calculation] finished [19.5928s]
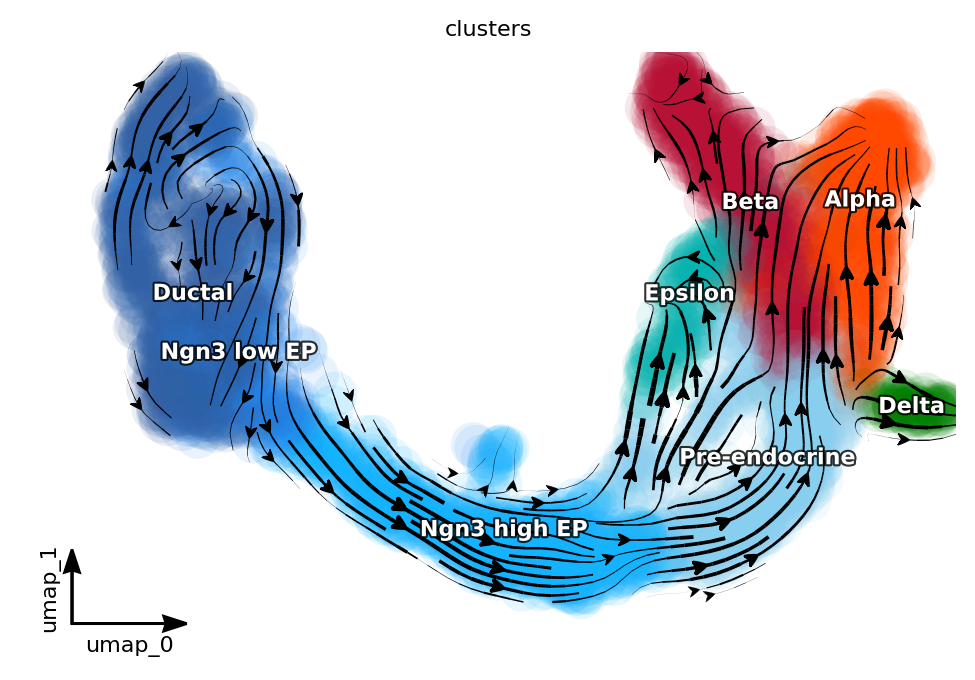
Project the RNA velocity onto the embedding space
The projection of RNA velocity imported from cellDancer onto the embedding space was done by using dynamo method cell_velocities().
[4]:
pancreas_cluster_cmap = {'Ductal': '#3361A5','Ngn3 low EP': '#248AF3','Ngn3 high EP': '#14B3FF','Pre-endocrine': '#88CEEF','Alpha': '#ff4800','Beta': '#B81136','Delta': 'green','Epsilon': '#03B3B0'}

dyn.tl.reduceDimension(adata, n_pca_components=30)
dyn.tl.cell_velocities(adata, method="pearson", other_kernels_dict={"transform": "sqrt"})
dyn.tl.cell_velocities(adata, basis="pca")

dyn.pl.streamline_plot(adata, color=["clusters"], basis="umap", color_key = pancreas_cluster_cmap, show_legend="on data", show_arrowed_spines=True)
|-----> retrive data for non-linear dimension reduction...
|-----? adata already have basis umap. dimension reduction umap will be skipped!
set enforce=True to re-performing dimension reduction.
|-----> [dimension_reduction projection] in progress: 100.0000%
|-----> [dimension_reduction projection] finished [0.0039s]
|-----> 0 genes are removed because of nan velocity values.
|-----> [calculating transition matrix via pearson kernel with sqrt transform.] in progress: 100.0000%
|-----> [calculating transition matrix via pearson kernel with sqrt transform.] finished [14.3924s]
|-----> [projecting velocity vector to low dimensional embedding] in progress: 100.0000%
|-----> [projecting velocity vector to low dimensional embedding] finished [1.0276s]
|-----> 0 genes are removed because of nan velocity values.
Using existing pearson_transition_matrix found in .obsp.
|-----> [projecting velocity vector to low dimensional embedding] in progress: 100.0000%
|-----> [projecting velocity vector to low dimensional embedding] finished [1.0609s]
|-----------> plotting with basis key=X_umap
|-----------> skip filtering clusters by stack threshold when stacking color because it is not a numeric type
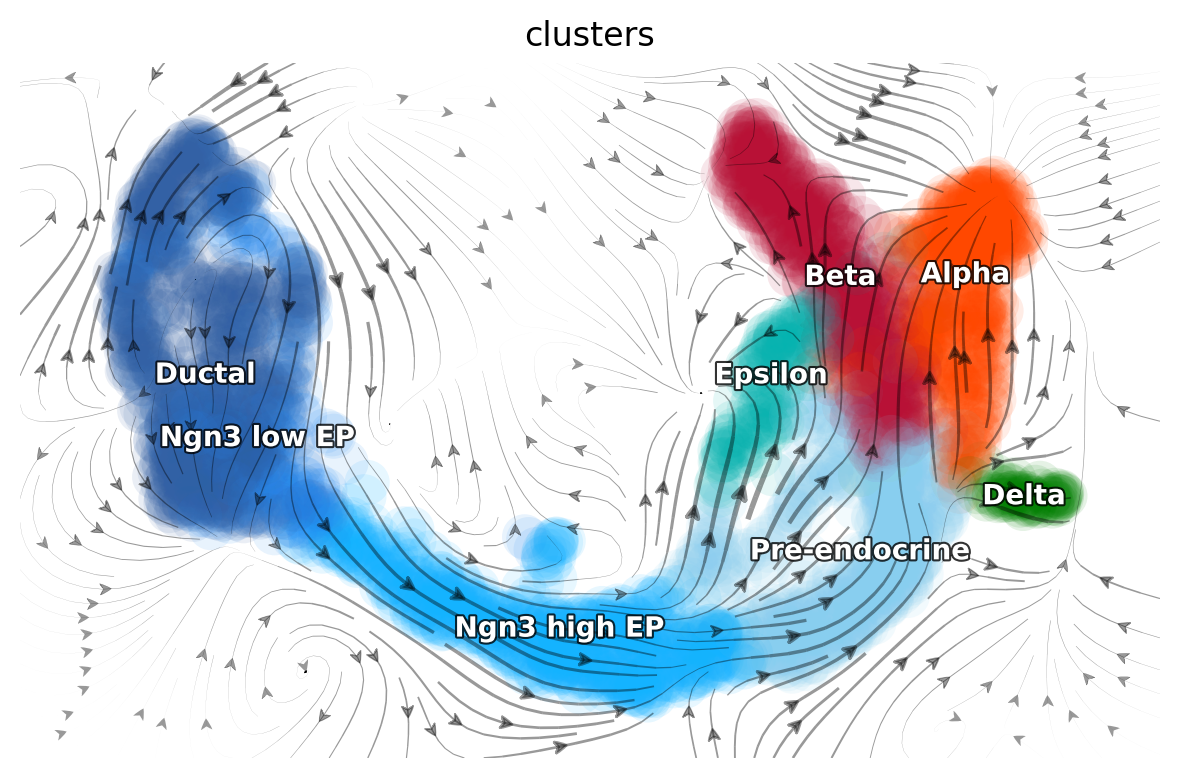
Learn the vector fields
We use dynamo to learn and visualize the vector fields on UMAP.
[5]:
dyn.vf.VectorField(adata, basis="pca", pot_curl_div=True)
dyn.vf.VectorField(adata, basis="umap", pot_curl_div=True)

dyn.vf.speed(adata, basis="pca")
dyn.vf.divergence(adata, basis="pca")
dyn.vf.acceleration(adata, basis="pca")
dyn.vf.curl(adata, basis="umap")
|-----> VectorField reconstruction begins...
|-----> Retrieve X and V based on basis: PCA.
        Vector field will be learned in the PCA space.
|-----> Learning vector field with method: sparsevfc.
|-----> [SparseVFC] begins...
|-----> Sampling control points based on data velocity magnitude...
|-----> [SparseVFC] in progress: 100.0000%
|-----> [SparseVFC] finished [0.3184s]
|-----> <insert> velocity_pca_SparseVFC to obsm in AnnData Object.
|-----> <insert> X_pca_SparseVFC to obsm in AnnData Object.
|-----> <insert> VecFld_pca to uns in AnnData Object.
|-----> Running ddhodge to estimate vector field based pseudotime in pca basis...
|-----> graphizing vectorfield...
|-----> incomplete neighbor graph info detected: connectivities and distances do not exist in adata.obsp, indices not in adata.uns.neighbors.
|-----> Neighbor graph is broken, recomputing....
|-----> Start computing neighbor graph...
|-----------> X_data is None, fetching or recomputing...
|-----> fetching X data from layer:None, basis:pca
|-----> method arg is None, choosing methods automatically...
|-----------> method ball_tree selected
|-----> <insert> connectivities to obsp in AnnData Object.
|-----> <insert> distances to obsp in AnnData Object.
|-----> <insert> neighbors to uns in AnnData Object.
|-----> <insert> neighbors.indices to uns in AnnData Object.
|-----> <insert> neighbors.params to uns in AnnData Object.
|-----------? nbrs_idx argument is ignored and recomputed because nbrs_idx is not None and return_nbrs=True
|-----------> calculating neighbor indices...
|-----> [ddhodge completed] in progress: 100.0000%
|-----> [ddhodge completed] finished [20.5809s]
|-----> Computing divergence...
Calculating divergence: 100%|█████████████████████| 4/4 [00:00<00:00, 9.94it/s]
|-----> <insert> control_point_pca to obs in AnnData Object.
|-----> <insert> inlier_prob_pca to obs in AnnData Object.
|-----> <insert> obs_vf_angle_pca to obs in AnnData Object.
|-----> [VectorField] in progress: 100.0000%
|-----> [VectorField] finished [21.5317s]
|-----> VectorField reconstruction begins...
|-----> Retrieve X and V based on basis: UMAP.
        Vector field will be learned in the UMAP space.
|-----> Generating high dimensional grids and convert into a row matrix.
|-----> Learning vector field with method: sparsevfc.
|-----> [SparseVFC] begins...
|-----> Sampling control points based on data velocity magnitude...
|-----> [SparseVFC] in progress: 100.0000%
|-----> [SparseVFC] finished [0.4374s]
|-----> <insert> velocity_umap_SparseVFC to obsm in AnnData Object.
|-----> <insert> X_umap_SparseVFC to obsm in AnnData Object.
|-----> <insert> VecFld_umap to uns in AnnData Object.
|-----> Running ddhodge to estimate vector field based pseudotime in umap basis...
|-----> graphizing vectorfield...
|-----------? nbrs_idx argument is ignored and recomputed because nbrs_idx is not None and return_nbrs=True
|-----------> calculating neighbor indices...
|-----> [ddhodge completed] in progress: 100.0000%
|-----> [ddhodge completed] finished [18.7982s]
|-----> Computing curl...
Calculating 2-D curl: 100%|██████████████| 3696/3696 [00:00<00:00, 15543.98it/s]
|-----> Computing divergence...
Calculating divergence: 100%|█████████████████████| 4/4 [00:00<00:00, 23.67it/s]
|-----> <insert> control_point_umap to obs in AnnData Object.
|-----> <insert> inlier_prob_umap to obs in AnnData Object.
|-----> <insert> obs_vf_angle_umap to obs in AnnData Object.
|-----> [VectorField] in progress: 100.0000%
|-----> [VectorField] finished [19.8864s]
Calculating divergence: 100%|█████████████████████| 4/4 [00:00<00:00, 10.07it/s]
|-----> [Calculating acceleration] in progress: 100.0000%
|-----> [Calculating acceleration] finished [0.1751s]
|-----> <insert> acceleration to layers in AnnData Object.
Calculating 2-D curl: 100%|██████████████| 3696/3696 [00:00<00:00, 17567.05it/s]
[6]:
dyn.pl.topography(adata, color=['clusters'], basis='umap', background='white',
                  streamline_color='black', color_key = pancreas_cluster_cmap, show_legend='on data', terms=("streamline"))
|-----> Vector field for umap is but its topography is not mapped. Mapping topography now ...
|-----------> plotting with basis key=X_umap
|-----------> skip filtering clusters by stack threshold when stacking color because it is not a numeric type
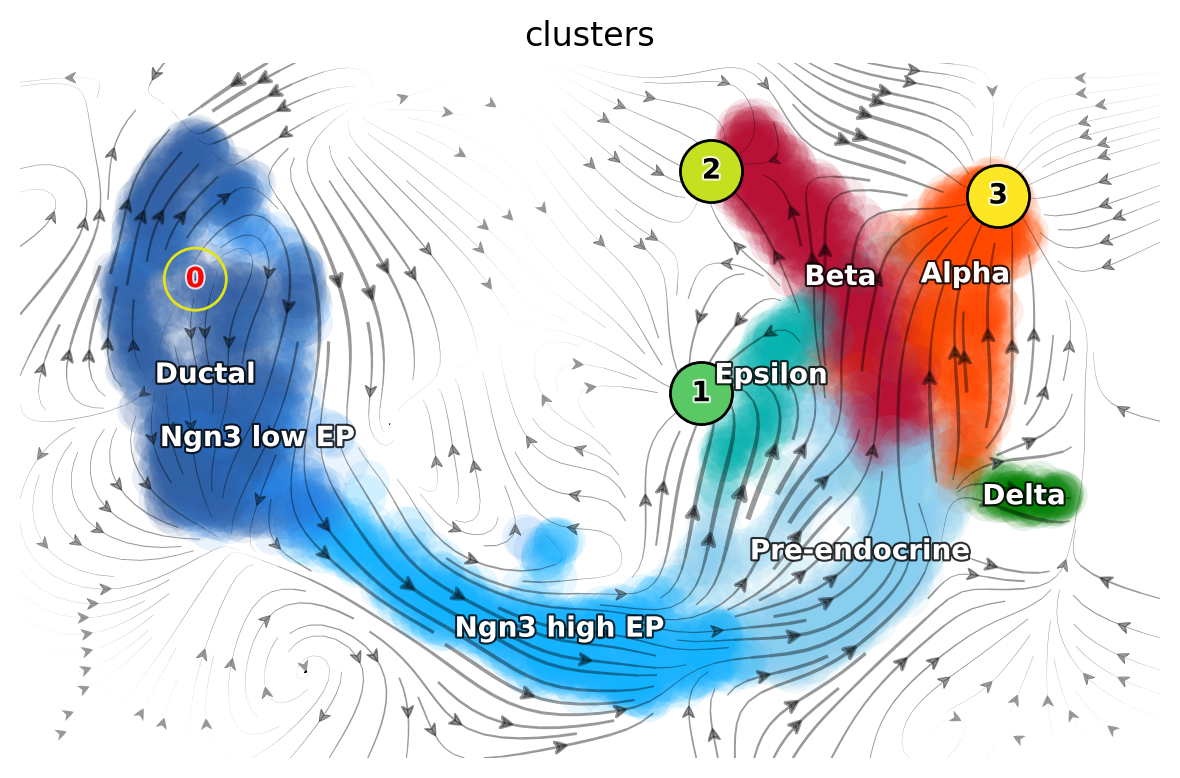
The emitting fixed point #0 is identified in ductal cells. The absorbing fixed points #1 #2 #3 are identified in Alpha-, Beta-, and Epsilon-cells.
[7]:
adata_load_fix_points=adata.copy()
Xss, ftype, conf = adata_load_fix_points.uns['VecFld_umap']['Xss'],\
                   adata_load_fix_points.uns['VecFld_umap']['ftype'],\
                   adata_load_fix_points.uns['VecFld_umap']['confidence']

fixed_points = [10,7,16,12]

adata_load_fix_points.uns['VecFld_umap']['Xss'] = Xss[fixed_points]
adata_load_fix_points.uns['VecFld_umap']['ftype'] = ftype[fixed_points]
adata_load_fix_points.uns['VecFld_umap']['confidence']=conf[fixed_points]

dyn.pl.topography(
    adata_load_fix_points,
    markersize=500,
    basis="umap",
    fps_basis="umap",
    color_key = pancreas_cluster_cmap,
    color=["clusters"],
    show_legend='on data',
    save_show_or_return='show'
)
|-----------> plotting with basis key=X_umap
|-----------> skip filtering clusters by stack threshold when stacking color because it is not a numeric type
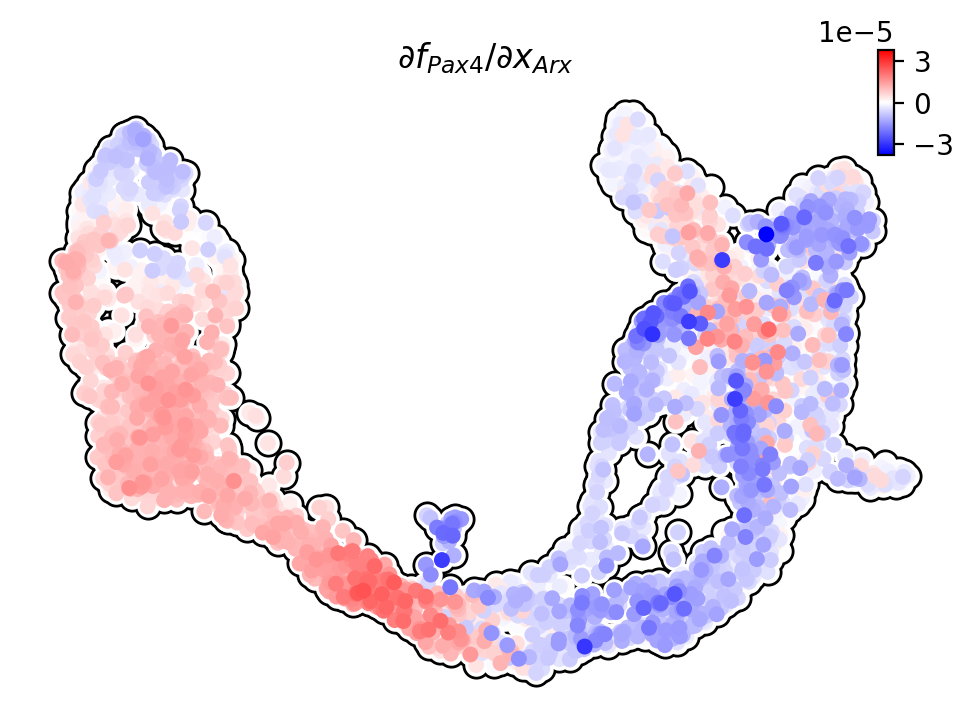
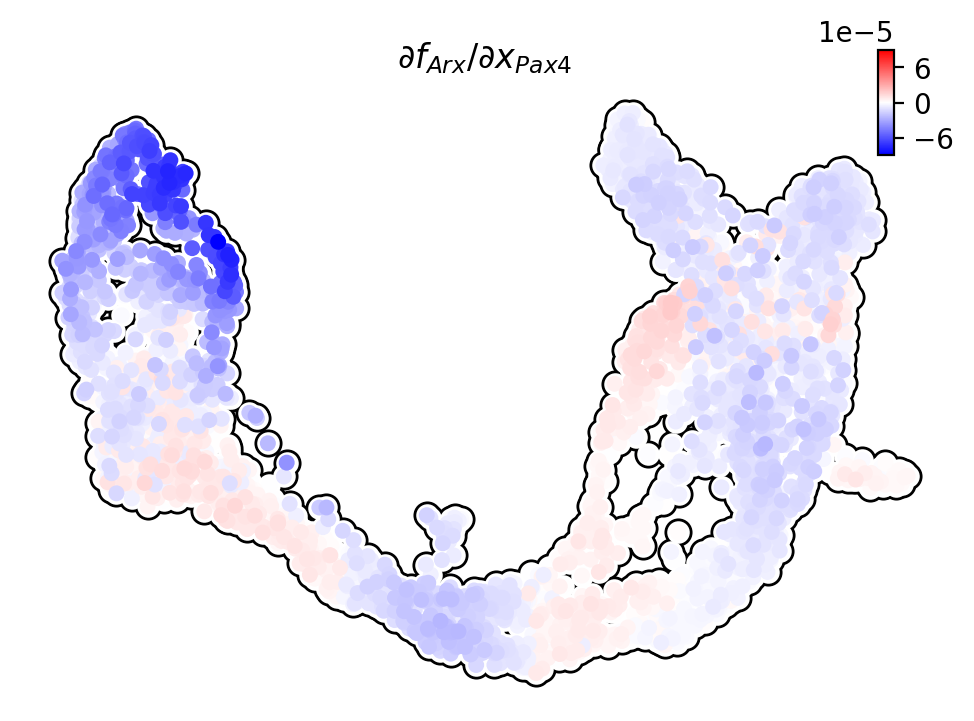
Jacobian analysis
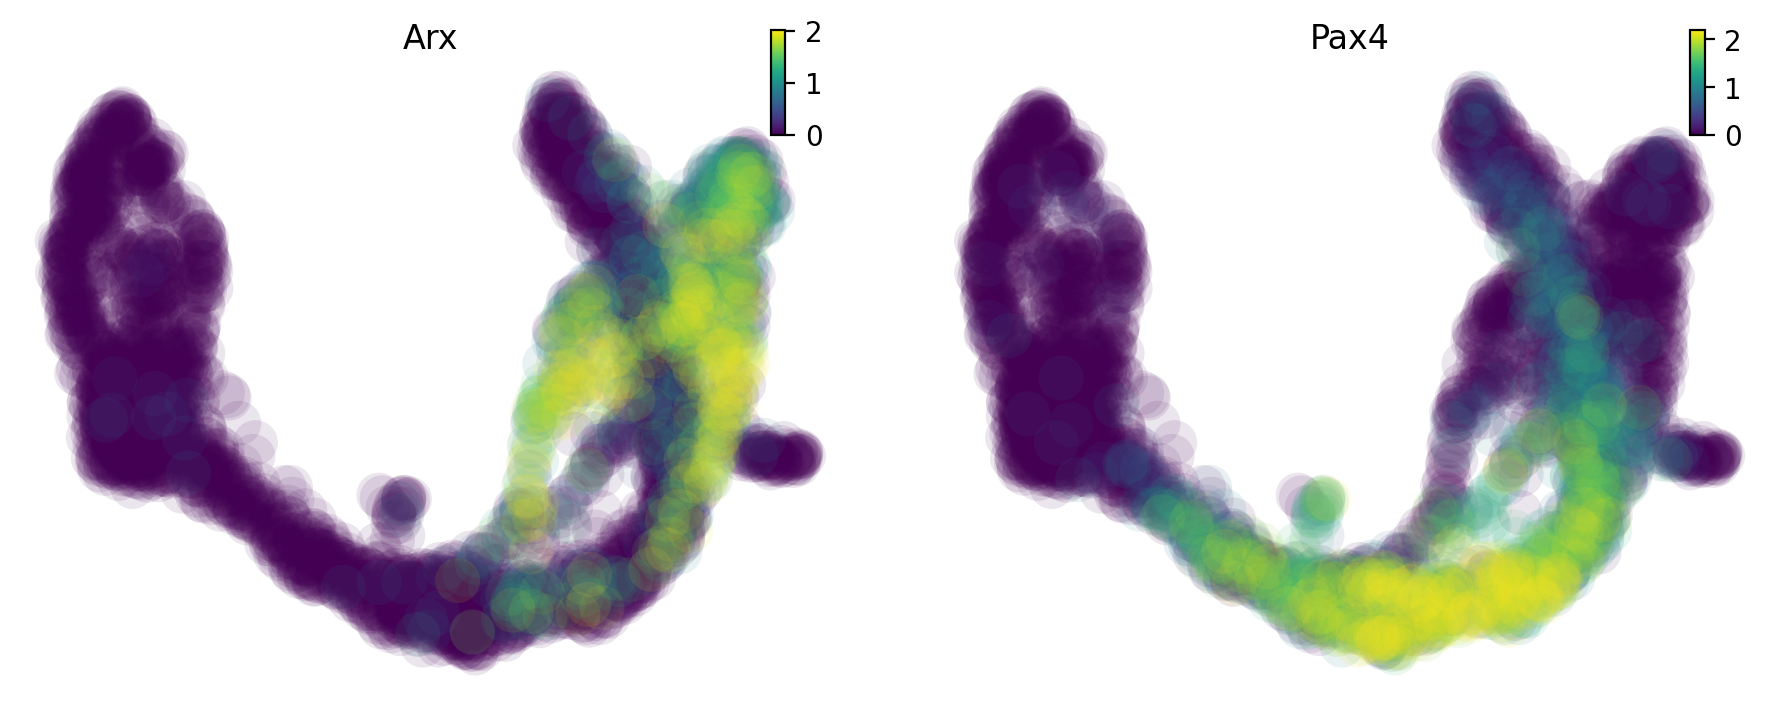
Jacobian analysis shows that Pax4 is down-regulated by Arx in the Alpha-cells; Arx is down-regulated by Pax4 in the Beta-cells.
[8]:
dyn.vf.jacobian(adata, regulators=['Arx','Pax4'])

dyn.pl.jacobian(
    adata,
    basis="umap",
    regulators=['Arx'],
    effectors=['Pax4'],
    alpha=1,
)

dyn.pl.jacobian(
    adata,
    basis="umap",
    regulators=['Pax4'],
    effectors=['Arx'],
    alpha=1,
)
Transforming subset Jacobian: 100%|██████| 3696/3696 [00:00<00:00, 98024.28it/s]
We use dynamo to plot the expression of Arx and Pax4 on UMAP.
[9]:
dyn.pl.umap(adata, color=["Arx",'Pax4'],save_show_or_return='show')
|-----------> plotting with basis key=X_umap