Case study 3: Pancreatic endocrinogenesis
This tutorial shows how cellDancer derives cell fates in the embedding space.
This tutorial also displays cellDancer’s ability to decipher cell identity based on the cell-specific reaction rates.
Below is the case study for pancreatic endocrinogenesis. We follow the gene and cell filtering methods of Bergen et.al. 3,696 cells with 2,000 genes are selected.
Import packages
To run the notebook locally, Installation could be referred to install the environment and dependencies.
[1]:
# import packages
import os
import sys
import glob
import pandas as pd
import math
import matplotlib.pyplot as plt
import celldancer as cd
import celldancer.cdplt as cdplt
from celldancer.cdplt import colormap
Load cellDancer result
We use the preprocessed data PancreaticEndocrinogenesis_cell_type_u_s.csv.zip to predict the RNA velocities (see the details of pre-processing steps Data Preparation). Below are the command we used for the RNA velocity estimation.
cellDancer_df = cd.velocity(cell_type_u_s, permutation_ratio=0.5, n_jobs=8)
The prediction result can be downloaded from PancreaticEndocrinogenesis_cellDancer_estimation.csv.zip.
[2]:
cellDancer_df_path = 'your_path/PancreaticEndocrinogenesis_cellDancer_estimation.csv'
cellDancer_df=pd.read_csv(cellDancer_df_path)
cellDancer_df
[2]:
| cellIndex | gene_name | unsplice | splice | unsplice_predict | splice_predict | alpha | beta | gamma | loss | cellID | clusters | embedding1 | embedding2 | |
|---|---|---|---|---|---|---|---|---|---|---|---|---|---|---|
| 0 | 0 | Scaper | 0.489151 | 0.211323 | 0.486841 | 0.185478 | 0.334391 | 0.629880 | 0.647696 | 0.043435 | AAACCTGAGAGGGATA | Pre-endocrine | 6.143066 | -0.063644 |
| 1 | 1 | Scaper | 0.278262 | 0.125742 | 0.293904 | 0.107517 | 0.224909 | 0.626946 | 0.648537 | 0.043435 | AAACCTGAGCCTTGAT | Ductal | -9.906417 | 0.197778 |
| 2 | 2 | Scaper | 0.374380 | 0.298116 | 0.348888 | 0.197525 | 0.213979 | 0.648890 | 0.665279 | 0.043435 | AAACCTGAGGCAATTA | Alpha | 7.559791 | 0.583762 |
| 3 | 3 | Scaper | 0.320497 | 0.198031 | 0.318165 | 0.146120 | 0.219611 | 0.636208 | 0.655523 | 0.043435 | AAACCTGCATCATCCC | Ductal | -11.283765 | 4.218998 |
| 4 | 4 | Scaper | 0.239145 | 0.141970 | 0.251417 | 0.106599 | 0.192050 | 0.631560 | 0.652837 | 0.043435 | AAACCTGGTAAGTGGC | Ngn3 high EP | 1.721565 | -4.753407 |
| ... | ... | ... | ... | ... | ... | ... | ... | ... | ... | ... | ... | ... | ... | ... |
| 7391995 | 3691 | Tmem63a | 0.000000 | 0.136270 | 0.000447 | 0.125414 | 0.005472 | 0.110095 | 0.067564 | 0.045492 | TTTGTCAAGTGACATA | Pre-endocrine | 4.768472 | -1.388353 |
| 7391996 | 3692 | Tmem63a | 0.028708 | 0.000000 | 0.021286 | 0.022931 | 0.017270 | 0.100517 | 0.072741 | 0.045492 | TTTGTCAAGTGTGGCA | Ngn3 high EP | -1.873335 | -4.182650 |
| 7391997 | 3693 | Tmem63a | 0.000000 | 0.312690 | 0.000200 | 0.288797 | 0.002445 | 0.116196 | 0.064809 | 0.045492 | TTTGTCAGTTGTTTGG | Ductal | -9.882250 | -0.105594 |
| 7391998 | 3694 | Tmem63a | 0.028052 | 0.154164 | 0.019519 | 0.165354 | 0.008143 | 0.107124 | 0.069812 | 0.045492 | TTTGTCATCGAATGCT | Alpha | 6.612424 | 4.531895 |
| 7391999 | 3695 | Tmem63a | 0.076389 | 0.046049 | 0.055438 | 0.101639 | 0.024521 | 0.098170 | 0.073695 | 0.045492 | TTTGTCATCTGTTTGT | Epsilon | 3.071044 | 1.120432 |
7392000 rows × 14 columns
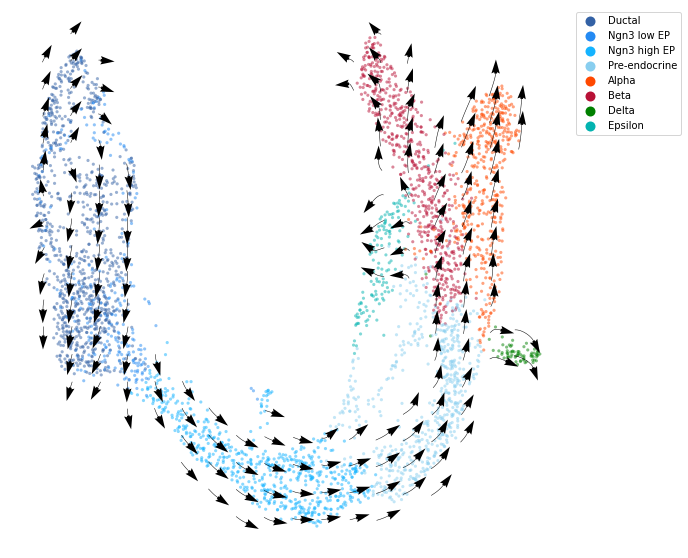
Project the RNA velocity onto the embedding space
We calculate the projection of RNA velocity on the embedding with cd.compute_cell_velocity(). The projected direction on embedding space, i.e. columns ‘velocity1’ and ‘velocity2’ are added to the original dataframe. We use cdplt.scatter_cell() to display the predicted direction on embedding space.
[3]:
# Compute cell velocity
cellDancer_df=cd.compute_cell_velocity(cellDancer_df=cellDancer_df, projection_neighbor_size=100)

# Plot cell velocity
fig, ax = plt.subplots(figsize=(10,10))
im = cdplt.scatter_cell(ax, cellDancer_df, colors=colormap.colormap_pancreas, alpha=0.5, s=10, velocity=True, legend='on', min_mass=5, arrow_grid=(20,20))
ax.axis('off')
plt.show()
Build UMAP based on reaction rates
We use cd.embedding_kinetic_para() to build the UMAP based on the predicted alpha, predicted beta, predicted gamma, or all of the three.
[4]:
cellDancer_df=cd.embedding_kinetic_para(cellDancer_df,'alpha')
cellDancer_df=cd.embedding_kinetic_para(cellDancer_df,'beta')
cellDancer_df=cd.embedding_kinetic_para(cellDancer_df,'gamma')
cellDancer_df=cd.embedding_kinetic_para(cellDancer_df,'alpha_beta_gamma')
We visualize the UMAP of kinetic parameter(s) with cdplt.plot_kinetic_para().
[5]:
fig, ax = plt.subplots(ncols=4, figsize=(16,8))
cdplt.plot_kinetic_para(ax[0], 'alpha_beta_gamma', cellDancer_df, color_map=colormap.colormap_pancreas)
cdplt.plot_kinetic_para(ax[1], 'alpha', cellDancer_df, color_map=colormap.colormap_pancreas)
cdplt.plot_kinetic_para(ax[2], 'beta', cellDancer_df, color_map=colormap.colormap_pancreas)
cdplt.plot_kinetic_para(ax[3], 'gamma', cellDancer_df, color_map=colormap.colormap_pancreas)
[5]:
<AxesSubplot:title={'center':'UMAP of gamma'}>
